


Investors have piled into cash and money market funds following the dramatic rise in rates from 2022. However, with interest rate cuts from central banks on the horizon, investors may want to consider moving some of that cash exposure elsewhere. Here, the Fidelity International fixed income team outline why they believe a natural first step is short dated high quality corporate bonds and then all-maturity corporate bonds once the curve dis-inverts.
Assets in money market funds are close to $6tn, having doubled from pre-pandemic levels, with Fidelity’s money market funds also seeing strong asset growth. For investors used to almost zero rates in the decade following the Global Financial Crisis the prospect of yields in excess of 5% from low-risk cash investments was, and is, attractive.
As our money market team attest, the case for cash remains strong. There will always be a need for cash, particularly for those investors prioritising liquidity and capital preservation. However, some investors may be allocating to cash for the prospect of outperformance versus other asset classes. While this was the right call in recent years (cash outperformed most asset classes in 2022, for example), those investors might want to consider corporate bonds looking ahead.
Interest rate cuts are just around the corner
The negative drivers of bond returns – inflation and interest rate hikes – are abating which sets fixed income up well for the period ahead. Inflation is moderating and central bankers are now talking about the timing of interest rate cuts. Accordingly, the market is now pricing in the first full 0.25% cut from the Bank of England (BoE) by August 2024, with the chances of a cut earlier in June.
Ahead of a cutting cycle cash rates are elevated because, like today, they tend to have followed a series of rate hikes which optically makes cash look attractive from a forward-looking return standpoint. As the chart below shows, today investors can generate an attractive yield to maturity from cash, which is similar to corporate bonds.

Source: Fidelity International, Bloomberg, 11 March 2024. 1-5yr Corporate Bonds = ICE BofA 1-5 Year Eurosterling Index; All Maturity Corporate Bonds = ICE BofA Euro-Sterling Index; Government Bonds = ICE BofA UK Gilt Index; High Yield Bonds = ICE BofA Sterling High Yield Index; FTSE 100; Sterling Cash = ICE BofA Sterling 1-Month Deposit Bid Rate Constant Maturity Index.
With rates expected to fall, it might be time to consider corporate bonds
So, why bother with corporate bonds if you can get more-or-less the same level of yield from cash? Firstly, cash is more exposed to reinvestment risk. Reinvestment risk refers to the risk that investors are unable to reinvest cashflows, such as coupons or principal, at a rate comparable to the current rate of return. As rates fall, cash and money market instruments are more exposed to this risk given these securities often have maturities measured in days (rather than years). This means cash yields (and returns) more closely follow central bank rates lower relative to bonds.
On the flipside, fixed income securities have a fixed income for a longer period of time and the value of those cash flows rises as interest rates fall. This impact is known as duration risk, a measure of the sensitivity of the price of a debt instrument to a change in interest rates (yields fall, prices rise). So, if central banks are due to cut rates, time to add as much duration as possible? Not quite, for two reasons. Firstly, markets tend to price in cuts before they happen and so the extent of the rally in bonds during a cutting cycle depends on how many cuts were already priced in. Secondly, as we highlight here, if the yield curve is inverted, like today, then short dated bonds can outperform longer dated bonds as the curve normalises despite having less duration risk. In these unique circumstances your position on the curve can be a more powerful driver of return than the absolute level of duration. The curve inversion makes us particularly constructive on 1-5yr corporate bonds.
Finally, through active management, we can pick those bonds with a more attractive level of yield per unit of risk to generate an excess yield over cash and comparable indices. For example, while the 1-5yr corporate bond market offers a yield of 5.2%, the yield to maturity on Fidelity Short Dated Corporate Bond (Fidelity’s active 1-5yr corporate bond fund) is 5.8%, offering 70bps in additional yield over the market.
History suggests high quality bonds tend to perform well versus cash in cutting cycles
If history is a useful guide, with rate cuts around the corner, it seems unlikely that cash will outperform safer bond assets again, but it may outperform high yield and equities. Bonds offer an attractive proposition as a first step back in, and particularly short dated corporate bonds for the more conservative investor. This is because bonds tend to perform well as central banks cut interest rates and – with the front end of the curve more sensitive to interest rate policy, and yield curves inverted – short dated bonds could stand to benefit more in the earlier phases of the cutting cycle. The chart below shows the 1yr return from different assets starting 3-months prior to the first BoE cut. If the BoE cut in December we started the return series in September, to account for markets pricing in cuts ahead of time and to make this a more useful guide for investors today (with cuts priced in over the next few months).
The chart shows that investment grade corporate bonds (short dated and all-maturity) and all maturity government bonds tend to perform well in cutting cycles with excess returns generated over cash (on average) over 1yr. High yield bonds show mixed results, down versus cash on average over 1yr. Equities have on average underperformed cash through rate cutting cycles with the DotCom and GFC crash being the primary reasons for the poor overall average
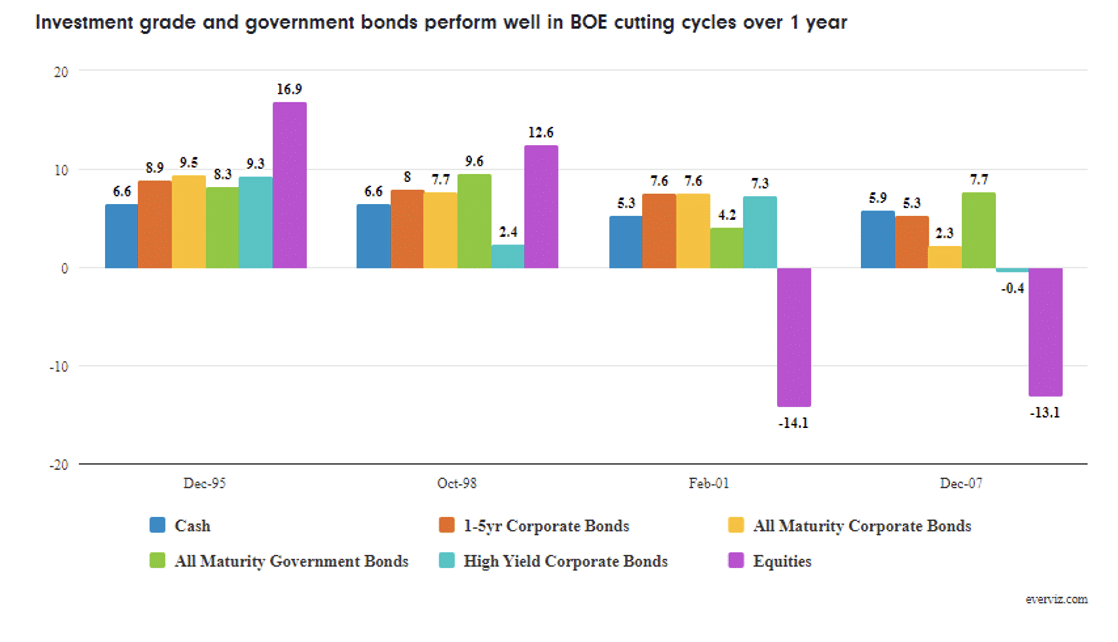
Source: Fidelity International, Bloomberg, March 2024. 1-5yr Corporate Bonds = ICE BofA 1-5 Year Eurosterling Index; All Maturity Corporate Bonds = ICE BofA Euro-Sterling Index; Government Bonds = ICE BofA UK Gilt Index; High Yield Corporate Bonds = ICE BofA US High Yield Index used for the first cutting cycle, while ICE BofA Global High Yield Index (GBP Hedged) was used for the remaining cycles; Equities = FTSE 100. Cash rate was ICE BofA British Pound 6-Month Deposit Bid Rate Constant Maturity Index for the first cutting cycle and then the ICE BofA Sterling 1-Month Deposit Bid Rate Constant Maturity Index for the remaining 3. Uses 4 Bank of England interest rate cutting cycles between 1995 and 2024, starting in December 1995, October 1998, February 2001 and December 2007 respectively. Returns start 3-months prior to first cut to incorporate the impact of expectations.
Corporate bonds offer a relatively safe option versus cash over the longer term
Investors with high cash allocations tend to be risk averse, so what about the worst-case outcome, and over a longer time horizon? As the chart below shows, over a 3yr holding period, the worst excess return over cash from 1-5yr corporate bonds in the cutting cycles we identified was +3.6%. This was in the 3yrs following October 1998, when cash delivered +19.2% returns while 1-5yr corporate bonds delivered +22.8% returns.
In the other 3 cutting cycles, 1-5yr corporate bonds outperformed cash by even more over 3yrs (with this outperformance ranging from +5.4% to +11.8%). For high yield and equities, the worst-case outcomes were -19.8% and -37.3% respectively over 3yrs. For high yield this was in the 3yrs post October 1998 when high yield delivered -0.6% returns versus cash at +19.2%.
For equities, this was in the 3yrs following February 2001, when the FTSE 100 was down 23.8% versus cash up at +13.5%. It is also notable that the FTSE 100 was down in absolute terms over 3yrs in 3 of the 4 cutting cycles we identified. The average 3yr return from the FTSE 100 versus cash in the four cases we identity is -7.4%, this is because central banks tend to cut into weakness to stimulate the economy.
Over 5yrs following a cutting cycle, all maturity corporate bonds stand out as a relatively safe option based on history with the worst-case excess return over cash at +14.2%. This was in the 5yrs following December 1995 when cash delivered +36.7% return versus all maturity corporate bonds at +50.9%. All maturity government bonds come in second, largely due to its higher duration profile (at 9.3yrs) relative to 1-5yr corporate bonds (at 2.6yrs).
For the risk averse investor looking to outperform cash in the medium term we think corporate bonds are set up well as the BoE starts to cut. Furthermore, with the yield curve inverted, 1-5yr corporate bonds may be an attractive option over 3yrs. Over the longer term (5yrs), all-maturity corporate bonds standout well as the curve normalises and investors can once again benefit from higher yields

Source: Fidelity International, Bloomberg, March 2024. 1-5yr Corporate Bonds = ICE BofA 1-5 Year Eurosterling Index; All Maturity Corporate Bonds = ICE BofA Euro-Sterling Index; Government Bonds = ICE BofA UK Gilt Index; High Yield Corporate Bonds = ICE BofA US High Yield Index used for the first cutting cycle, while ICE BofA Global High Yield Index (GBP Hedged) was used for the remaining cycles; Equities = FTSE 100. Cash rate was ICE BofA British Pound 6-Month Deposit Bid Rate Constant Maturity Index for the first cutting cycle and then the ICE BofA Sterling 1-Month Deposit Bid Rate Constant Maturity Index for the remaining 3. Uses 4 Bank of England interest rate cutting cycles between 1995 and 2024, starting in December 1995, October 1998, February 2001 and December 2007 respectively. Returns start 3-months prior to first cut to incorporate the impact of expectations.
Better off in government bonds?
So why not go for government bonds as the BoE starts to cut? Firstly, we find that 1-5yr corporate bonds outperform government bonds on average in the first year following cuts and, as above, the worst-case outcomes are better in 1-5yr corporate bonds over 3yrs, while more attractive in all maturity corporate bonds over 5yrs. Why? Because investors in corporate bonds benefit from the credit spread, the additional yield for lending to corporates over government bonds. The credit spread today is roughly 1%, providing an additional tailwind to performance. This is despite the all-maturity Gilt index having much more duration than both the 1-5yr and all maturity corporate bond indices, reaffirming the notion that position on the curve is important in a cutting cycle. The credit spread also provides a mild cushion against yield rises.
What if the BoE don’t cut? It takes a relatively large yield move to lose a years’ worth of carry
What is the risk to this view? If rates stay on hold or the BoE start to hike. The likelihood of hikes seems low, but we cannot discount this, or a continued hold. The good news for corporate bond investors is that yields have risen materially in the last 2yrs, meaning the starting point for return from corporate bonds is attractive and it therefore takes a relatively large yield move to ‘wipe out’ a years’ worth of carry. This is known as the breakeven rate (calculated as yield to maturity divided by interest rate duration). As the chart below shows, 1-5yr corporate bonds have a breakeven rate of 2.0%, meaning yields need to rise by 2% before you lose a years’ worth of carry. 3yrs ago this breakeven rate was 0.3%. The breakeven rate for 1-5yr corporate bonds compares favourably to all maturity corporate bonds and all maturity Gilts, at 0.9% and 0.4% respectively. On balance, short dated corporate bonds seem like an attractive risk-adjusted option.
Perhaps it is time to put some of that cash into corporate bonds.
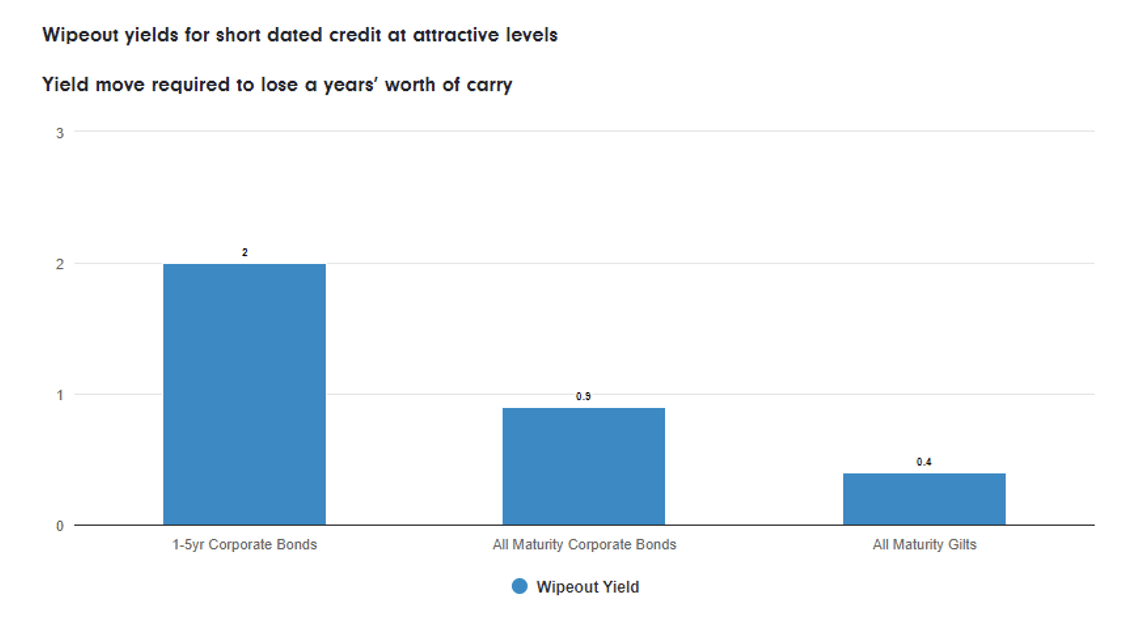
Source: Fidelity International, Bloomberg, 11 March 2024. 1-5yr Corporate Bonds = ICE BofA 1-5 Year Eurosterling Index; All Maturity Corporate Bonds = ICE BofA Euro-Sterling Index; Government Bonds = ICE BofA UK Gilt Index. Wipeout yield is worked out as yield to maturity divided by interest rate duration and is a measure of the yield move required to ‘Wipeout’ a years’ worth of carry.
Important Information
This information is for investment professionals only and should not be relied upon by private investors. Past performance is not a reliable indicator of future returns. Investors should note that the views expressed may no longer be current and may have already been acted upon. The value of bonds is influenced by movements in interest rates and bond yields. If interest rates and so bond yields rise, bond prices tend to fall, and vice versa. The price of bonds with a longer lifetime until maturity is generally more sensitive to interest rate movements than those with a shorter lifetime to maturity. The risk of default is based on the issuers ability to make interest payments and to repay the loan at maturity. Default risk may therefore vary between government issuers as well as between different corporate issuers. Due to the greater possibility of default, an investment in a corporate bond is generally less secure than an investment in government bonds. Fidelity’s fixed income range of funds can use financial derivative instruments for investment purposes, which may expose them to a higher degree of risk and can cause investments to experience larger than average price fluctuations. Reference in this document to specific securities should not be interpreted as a recommendation to buy or sell these securities and is only included for illustration purposes. Issued by FIL Pensions Management, authorised and regulated by the Financial Conduct Authority and Financial Administration Services Limited, authorised and regulated by the Financial Conduct Authority. Fidelity International, the Fidelity International logo and F symbol are trademarks of FIL Limited.