


Fund calibre analysis reveals a spectre from the past.
One of the narratives which has stood out in the past few years is that bonds and equities had become increasingly correlated.
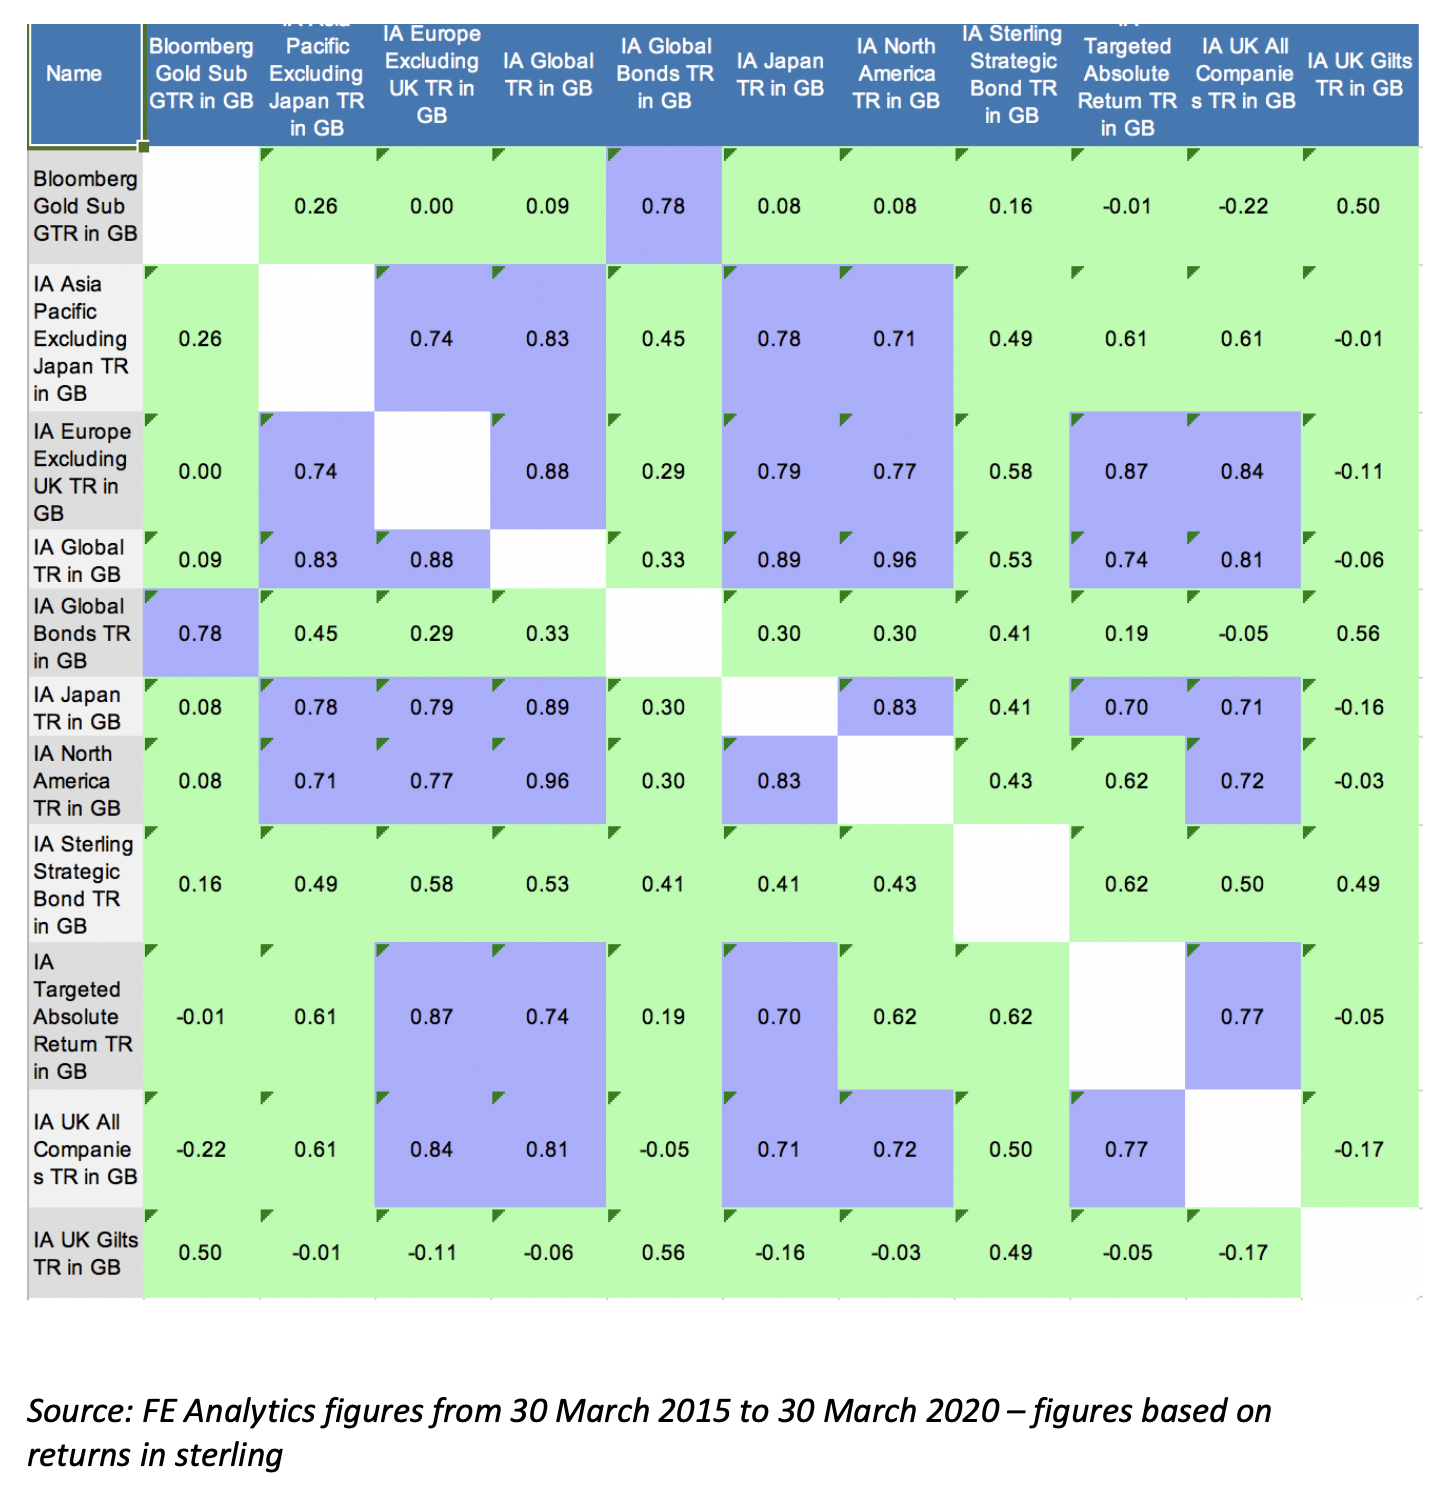
As the first chart below shows, over five years there has been gentle correlation between both. However, the recent sell-off has reversed those trends in style, with negative correlation appearing in abundance.
Negative correlation is not just about performance – it also demonstrates diversification and the spread of risk. Most portfolio construction theories cite the need for negative correlation when building a portfolio.
Take the IA Gilts and IA Asia Pacific ex-Japan sectors as a good example – it is -0.96 correlated in the past four months (see chart below) about as uncorrelated as you can be. To put this into context, the average correlation for the past five years is -0.01.

Asia has been the standout equity market globally, having fallen earlier given the origins of the pandemic. It has improved recently and now has significant dispersion, from a correlation perspective, to other asset classes.
The sell-off has also breathed some life into the bond market which, until recently, was seen to have an unfavourable risk/return profile. Global bonds is a classic example of the recent negative correlation, as many funds are not hedged in sterling, which has suffered even more due to the Brexit backdrop. The result is a sector which is heavily uncorrelated to most major markets.
The figures are staggering – but diversification looks to be back.