Jenn-Hui Tan, Global Head of Stewardship and Sustainable Investing and the Fidelity International analyst team looked at over 2,600 companies using the company’s proprietary ESG ratings to find our whether those with a higher rating have outperformed their lower-rated peers. The results lend further credence that ESG should be at the heart of active portfolio management.
Our proprietary ESG, or sustainability, ratings (from A to E) are derived from our fundamental analysis and engagement with the companies themselves. Like our overall analyst ratings, they are intended to be a forward-looking assessment of a company’s sustainability profile. The rating system gave us a wealth of data to analyse the dispersion of returns between the five levels during the recent crash.
Our hypothesis, when starting the research, was that the companies with good sustainability characteristics have more prudent and conservative management teams and will therefore demonstrate greater resilience in a market crisis.
Our equity findings
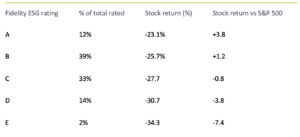
In the 36 days between 19 Feb and 26 March, the S&P 500 fell 26.9%. Meanwhile, the price of a share in companies with a high (A or B) Fidelity ESG rating dropped less than that on average, while those rated C to E fell more than the benchmark.
Attention to ESG earns market outperformance
Source: Fidelity International, April 2020. Note: Data from 2,689 company ratings.
On average among the 2,689 companies rated, each ESG rating level was worth 2.8 percentage points of stock performance versus the index during that period of volatility.
Sector views
The unusual circumstances of the market crash – a broad-based economic shutdown to slow the spread of the deadly Covid-19 virus – meant that some sectors naturally outperformed others depending on the threat that the virus outbreak posed to their businesses. Companies in the information technology and healthcare sectors behaved defensively compared to peers in, for example, the industrials or financials sectors.
Within almost all sectors we found that the dispersion of returns of companies rated A-E reflected that seen at an overall level. For example, in healthcare, which was the second best performing MSCI sector index with a 16% decline, the dispersion follows a similar pattern. The A-rated ESG stocks fell 12%, while the Bs fell 18% and the only E-rated stock dropped 32%. While there was no difference in returns for C and D-rated healthcare names, which fell an average of 20%, they still underperformed their more highly-rated peers.
Rating direction
When assigning a sustainability rating, our analysts also indicate whether they think a company ESG’s performance is improving, deteriorating or stable. It is notable that 31% of companies have an improving outlook, with only 4% seen to be in decline, which is broadly indicative of how seriously ESG is being taken at the highest levels of company boardrooms.
Looking at returns, those companies with a deteriorating outlook underperformed stable and improving peers for most rating levels. Taken as a group, their stocks fell an average of 29.6% in the market sell-off, compared with 26.5% for companies with a stable outlook and 27.6% for improving names.
Market recovery
The picture becomes a bit murkier when comparing the performance of the ESG ratings over a single day in which the market went up sharply. We analysed the performance of stocks on 6 April 2020, a day in which the average share in our ratings universe increased by 5.7%. During this rally, the dispersion pattern dissolved. The A-rated stocks increased by 5.2%, underperforming the average by 0.5%.
Meanwhile, the shares of companies rated C and D increased by an average of 5.8%. However, the companies with the poorest ESG rating underperformed that day’s rally by the widest margin, increasing by an average of just 4.5%.
Our fixed income findings
The findings in fixed income are similar to those in equity. The securities of higher-rated ESG companies performed better on average than their lower-rated peers from the start of the year up to March 23, on an unadjusted basis.
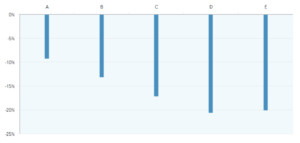
The bonds of the 149 A-rated companies returned -9.2% on average, compared with -13.2% for B-rated companies and -17.1% for C rated companies. There is some bunching between D and E-rated companies around the -20% level, which may be explained by the latter’s low sample size of 27 companies.
High quality ESG leads to better fixed income returns – excess credit return
Source: Fidelity International, April 2020. Note: Data from 1,398 company ratings.
Not all bonds are created equal. We observed that companies with a high ESG rating also had a lower average credit spread (OAS) to start with, indicating that they are high quality names and would be expected to outperform lower rated peers in volatile markets
The sell-off wasn’t so indiscriminate
The recent period of market volatility was shocking in its severity. A natural behavioural reaction to market crises is to lower investing horizons and focus on short-term questions of corporate survival, pushing longer-term concerns about environmental sustainability, stakeholder welfare and corporate governance to the background.
But this short-termism would indeed be short-sighted. Our research suggests that, what initially looked like an indiscriminate sell-off did in fact discriminate between companies based on their attention to ESG matters. It supports our view that a company’s focus on sustainability factors are fundamentally indicative of its board and management quality.
This leads to more resilient businesses in downturns that will be better positioned to capture opportunities when economic activity resumes – demonstrating that ESG is more than earning its place at the heart of active portfolio management.
To find out more about Fidelity’s approach to sustainable investing and our proprietary ratings click here >
Benefit from the latest market commentary from Fidelity CIOs and portfolio managers:
- Perspectives: weekly topical insights from experts spanning the breadth of our investment capability
- Live webcasts: live and interactive webcasts with Fidelity CIOs and portfolio managers
- On-demand webcast recordings: listen again to any of Fidelity’s latest webcast recordings
This information is for investment professionals only and should not be relied upon by private investors.
Investors should note that the views expressed may no longer be current and may have already been acted upon. Changes in currency exchange rates may affect the value of an investment in overseas markets. A portfolio that focuses on securities of companies which maintain strong environmental, social and governance (“ESG”) credentials may result in a return that at times compares unfavourably to similar portfolios without such focus. No representation nor warranty is made with respect to the fairness, accuracy or completeness of such credentials. The status of a security’s ESG credentials can change over time. The value of bonds is influenced by movements in interest rates and bond yields. If interest rates and so bond yields rise, bond prices tend to fall, and vice versa. The price of bonds with a longer lifetime until maturity is generally more sensitive to interest rate movements than those with a shorter lifetime to maturity. The risk of default is based on the issuers ability to make interest payments and to repay the loan at maturity. Default risk may therefore vary between government issuers as well as between different corporate issuers. Reference to specific securities should not be interpreted as a recommendation to buy or sell these securities but is included for the purposes of illustration only. Issued by Financial Administration Services Limited and FIL Pensions Management, authorised and regulated by the Financial Conduct Authority. Fidelity, Fidelity International, the Fidelity International logo and F symbol are trademarks of FIL Limited. UKM0420/30170/SSO/NA


