























As the green bond market matures, the case that investors must sacrifice yield for sustainability is becoming increasingly difficult to justify. Steve Williams, Head of EMEA Global Fixed Income at Amova Asset Management discusses this further.

In the early years of the green bond market, a greenium did exist. Supply of green bonds was limited, demand from ESG‑focused investors was concentrated, and prices reflected that imbalance.
But as the market has grown and diversified, the assumption that investors must sacrifice yield has become increasingly difficult to support. The question is not whether the greenium once existed, but whether it still does – and if so, where does it still exist?
Most research into the greenium has been methodologically narrow. A notable recent study examined around 3,500 bonds, focused exclusively on euro‑denominated investment grade debt, and covered only the last three years of market data.
Conclusions drawn from a sample that is constrained in scope risk reflecting the parameters of the study as much as the market itself. Our research team took a different approach.
Using ICE index data covering the entire USD 70 trillion global bond market, our team built a dataset of approximately 2.1 million observations collected on a monthly basis from 2017 onwards.
The dataset spans multiple currencies, with EUR‑denominated bonds accounting for around 60% and USD bonds around 20%, with GBP, AUD and CAD making up most of the remainder.
Over that period, green bonds have grown from around 1.5 – 2% of the total market to approximately 9 – 10% today.
Rather than looking at the market as a single aggregate, our research examined the cross‑section of data across currencies, sectors, ratings and time periods.
The result is a model with a significantly better statistical fit than prior studies, explaining around 75% of the variation in spreads compared to approximately 25% for the narrower approach.
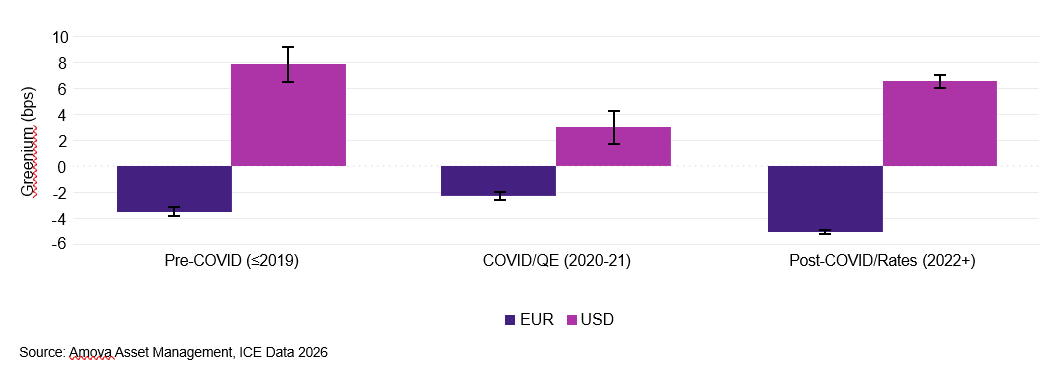
Our findings challenge the conventional view of the greenium in two important ways. In our research we have found that within EUR‑denominated markets comparable to or higher than conventional equivalents, rather than the lower yields that a greenium assumption would suggest.
Also, where a modest premium has emerged in Europe, it appears concentrated in the period from 2023 onwards and is likely linked to broader market conditions, including higher volatility, longer duration positioning and the quality premium that green bonds generally attract in periods of stress, rather than reflecting a structural feature of the green bond market itself.
For the USD market, the picture is clearer. Our research finds green bonds in the US have consistently offered investors higher yields than traditional equivalents across the study period.
Investors have not been paying more for the sustainability label, and in many cases, they have been paid more for holding it, perhaps between five and ten basis points per year (Chart 1, 2).
Chart 1 Greenium by month and currency (negative values indicate higher prices or lower yields for green bonds):
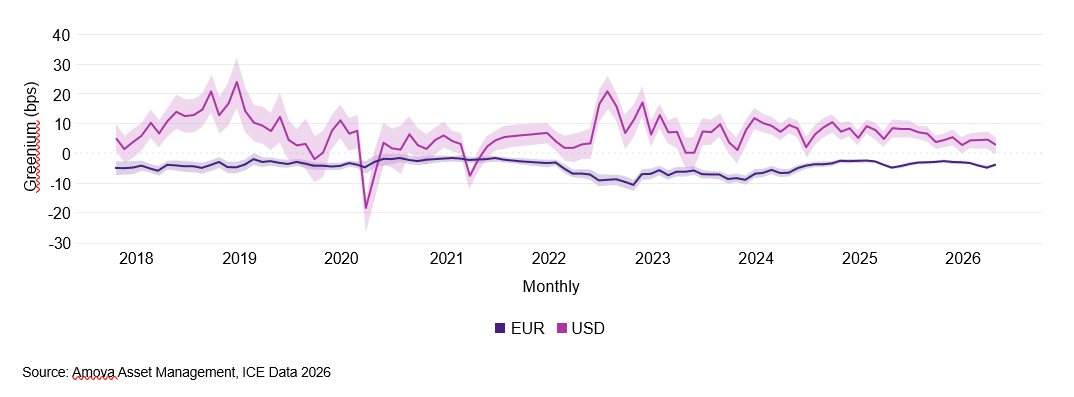
Chart 2 Greenium by regime period and currency – Amova AM Model (negative values indicate higher prices or lower yields pricing for green bonds, ±1 standard error):
What earlier studies missed
Many of the pricing differences associated with green bonds may actually reflect broader bond characteristics rather than the green label itself. Green bonds are often issued by higher‑quality borrowers and therefore tend to carry lower coupons, while lower‑quality issuers generally need to offer higher coupons and wider spreads to attract investors.
Green bonds also tend to have longer durations, which naturally leads to wider spreads because investors are exposed to interest rate and inflation risks for longer.
Other factors, such as convexity, liquidity and volatility, also play an important role in pricing. The distribution of green bond ratings across the market is broadly similar to conventional bonds, spanning the full range from triple‑A to triple‑B, so ratings alone do not explain the pricing differences observed.
A further control variable in the research is bond richness: bonds that are already trading expensively relative to their fundamental value tend to have tighter spreads, and accounting for this separates the green label effect from temporary pricing anomalies.
Overall, once these structural factors are taken into account, evidence for a consistent green premium becomes much weaker.
The model explaining around 75% of spread variation suggests that most of what has historically been attributed to the green label is better explained by the underlying characteristics of the bonds themselves.
Sector variation matters
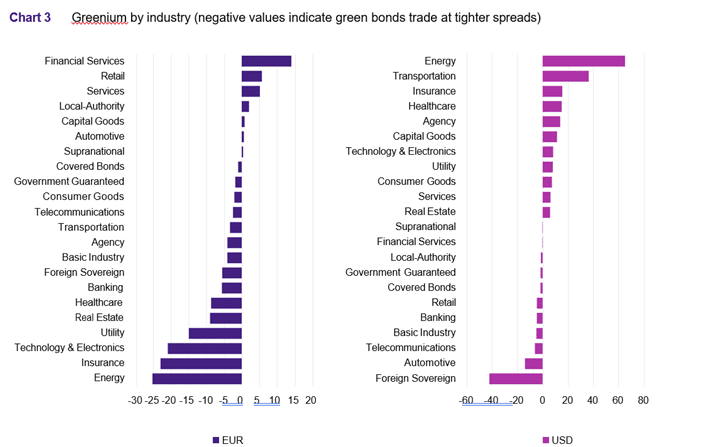
Even within these broad regional findings, the picture varies meaningfully by sector. In Europe, investors in utilities, insurance and telecommunications have tended to receive lower yields on green bonds than their conventional counterparts, with utilities being the most pronounced.
In the US, investors in energy, transportation and insurance have tended to receive higher yields on green bonds than on conventional equivalents. The practical implication is that any difference in yield associated with the green label is neither uniform nor unavoidable.
Investors who understand the sector dynamics can therefore position their bond portfolios to minimise any residual pricing differential and in many cases benefit from it.
The variation in the greenium across different sectors and currencies is not just an academic observation. For active managers, it creates a source of alpha that does not exist in conventional fixed income.
More importantly, the greenium is not static. Supply and demand dynamics in different sectors can push green bond pricing to extremes in either direction, creating windows where green bonds are available at a meaningful discount to conventional equivalents.
In the utilities sector, for example, periods of heavy supply have at times pushed green bond yields above those of comparable conventional bonds, creating a window to buy at a discount before pricing normalises.
The reverse is equally true: when a sector’s greenium becomes expensive, rotating into cheaper sectors preserves value without compromising the sustainability objective.
This kind of rotation is only possible for investors who are actively monitoring pricing differentials across the full cross‑section of the market. For passive strategies, the greenium is simply the cost or benefit the index delivers.
For active managers, it is a source of return that compounds over time alongside the credit and duration decisions that drive conventional fixed income performance.
What this means for investors
The research suggests that fears about giving up returns by investing in green bonds are largely overstated. In the US, green bonds have consistently offered higher yields or traded at lower prices than comparable conventional bonds.
In Europe, green bond yields have generally been similar to conventional bonds, with any recent differences driven more by specific sectors and market conditions than by the green label itself.
More importantly, any remaining yield differences can be managed relatively easily through sector and currency positioning. In some parts of the market, particularly in the US where negative sentiment towards ESG has pushed green bond yields higher, investors are actually being rewarded rather than penalised for choosing the sustainable option.
If some investors have held back on investing in sustainable fixed income because of performance concerns, it may be time to reconsider.
Main image: green, investment, rob-wicks-XyrZYDr2jWM-unsplash