






















Geopolitical shocks that rattle oil markets have repeatedly tested investor nerves but history consistently rewards those who stay the course.
Analysis from the VAM Funds team examines five major oil price shocks between 1973 and 2026, tracking how large and small-cap US equity indices performed from peak drawdown through to recovery and beyond.
When geopolitical shocks send oil prices spiralling, the instinct to act can be overwhelming.
Our latest analysis cuts through the noise with the historical perspective that long-term investors need right now.
Covering five major oil crises from 1973 to 2026, we map the full journey – drawdown, recovery, and the returns that followed, across large and small-cap US equities, so you can show your clients exactly what staying invested has meant in practice.
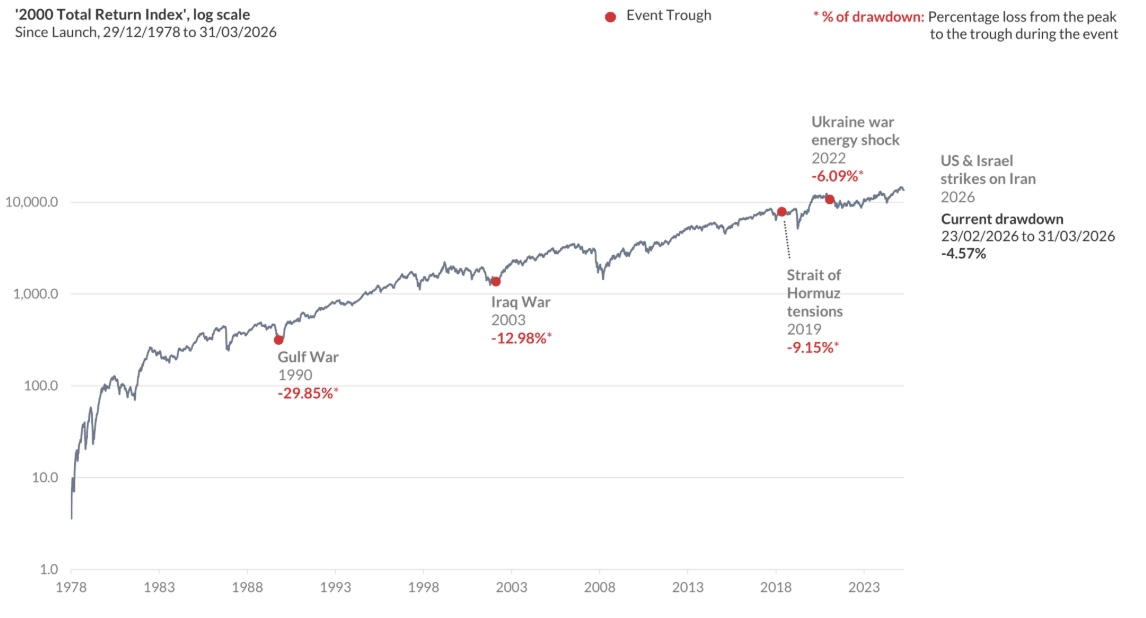
The 1973 Arab Oil Embargo is excluded as the ‘2000 Total Return index’ launched in 1978.
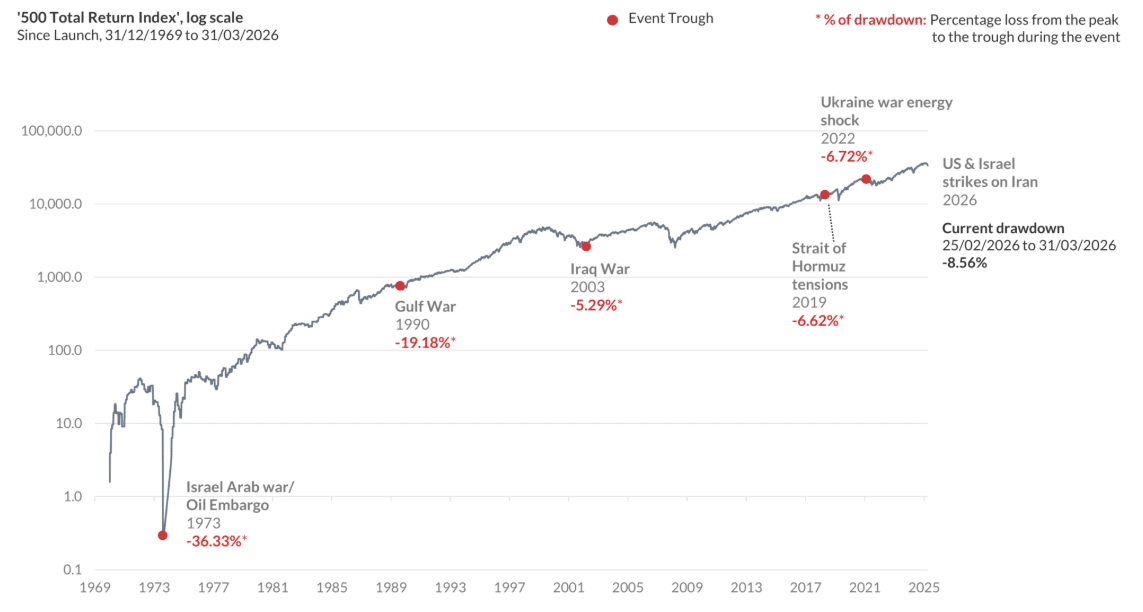
Each annotated event is marked at its market trough, the lowest point reached during the drawdown period.
The red figure shows the maximum drawdown from peak to trough during the event.
The log scale ensures that percentage moves are visually comparable across the full 55-year period regardless of absolute index level, making clear that every crisis, however severe in the moment, has been a temporary interruption to a persistent long-term upward trend.
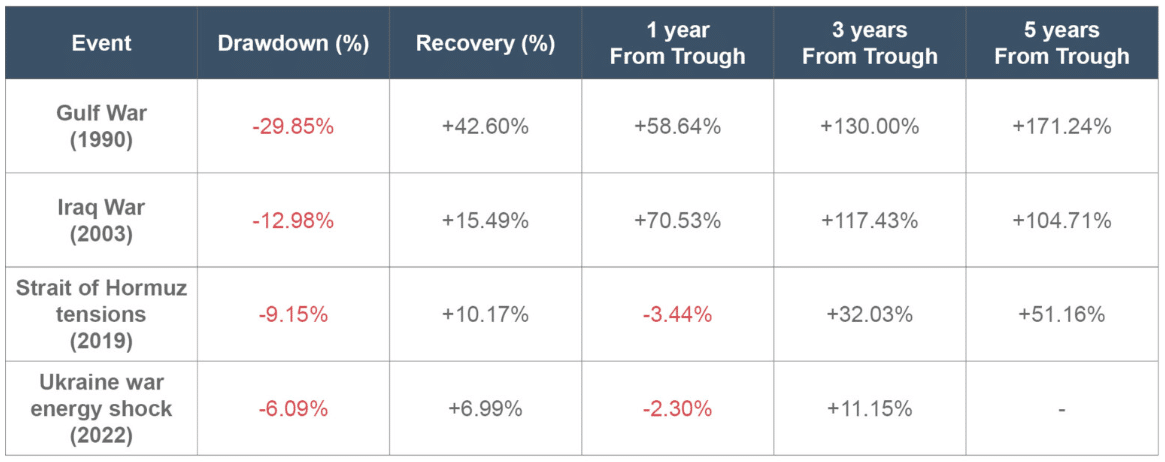
Event summary: Drawdown, recovery and forward returns
500 Total Return Index*

2000 Total Return Index*
The case for staying the course
The pattern across five decades is unambiguous: oil shocks create fear, fear creates opportunity, and patience has been consistently rewarded.
As geopolitical uncertainty once again dominates headlines, this analysis gives you the evidence to anchor client conversations in history rather than emotion. Holding steady at the trough has historically been where the most meaningful returns are made.
*Drawdown %: percentage loss from the market peak to the trough during the event. Recovery %: percentage gain required to return from the trough back to the prior peak level.
Forward returns (1, 3, 5 years): cumulative ‘500 Total Return’ and ‘2000 Total Return’ from the trough date. — = data not yet available.
Source: Lipper as of 31/03/2026. Past investment performance is not a reliable indicator of future returns. Hypothetical performance is not necessarily indicative of future performance.*
Past performance is not a reliable guide to future returns. You may not get back the amount originally invested, and tax rules can change over time. The writer’s views are their own and do not constitute financial advice.
This information should not be relied upon by retail clients or investment professionals. Reference to any particular investment does not constitute a recommendation to buy or sell the investment.
Main image: history, word, markus-winkler-H8SQHzxVk-A-unsplash